ContainerTurn
One diesel index can leave dedicated drayage lanes with different fuel exposure
Written by ContainerTurn Editorial Team · Reviewed by ContainerTurn Operations Review · Published
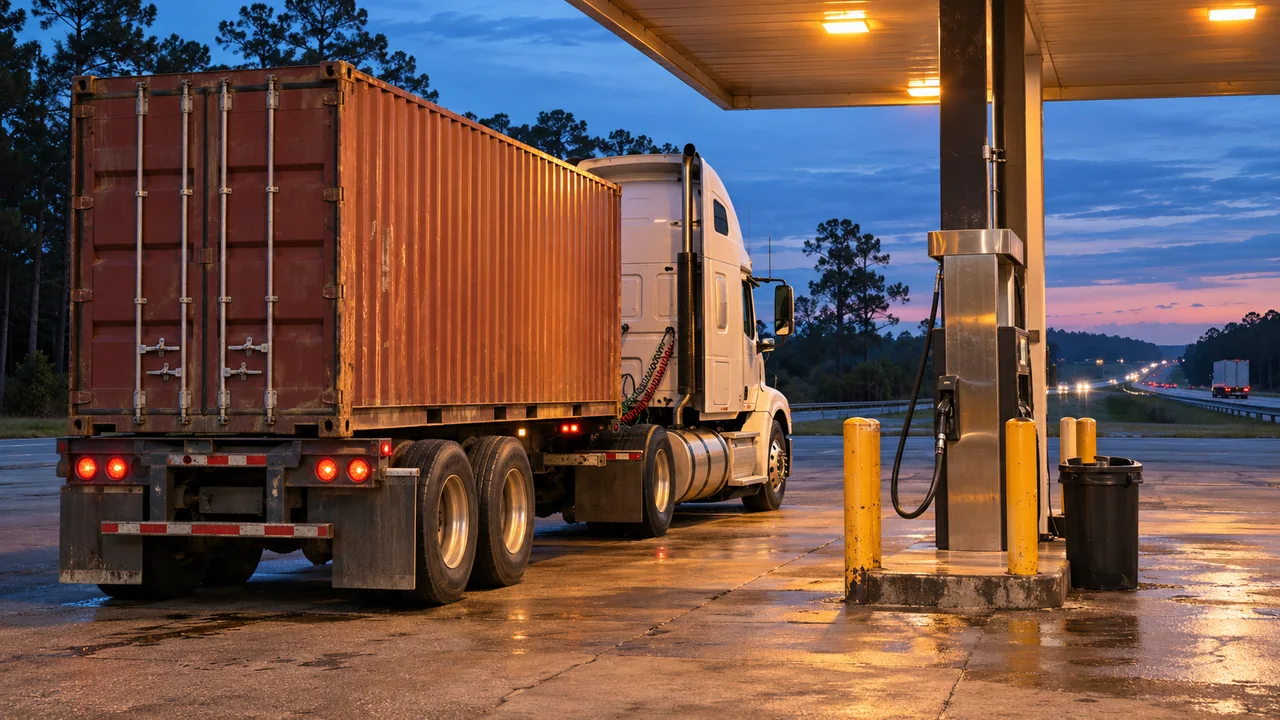
Compare EIA’s national, Lower Atlantic and California diesel benchmarks before reusing a single fuel surcharge across dedicated container lanes.
The finding
Between October 26 and November 9, the EIA national diesel average fell 22.5 cents per gallon. Its Lower Atlantic average fell 19.6 cents and California fell 25.8 cents. A contract indexed nationally will settle correctly under its own terms, but the adjustment can differ from the change in a lane’s regional benchmark. Test that difference when bidding dedicated routes that fuel in different markets.
What this changes operationally
Who should pay attention
Shippers and carriers bidding dedicated container lanes across multiple fueling regions or rebasing existing surcharge tables.
What to check next
Test the agreed index against the region where the truck normally buys fuel. Record the base price, gallons or mileage and fuel economy, observation week, reset day and when the surcharge moves down as well as up.
What this cannot prove
Regional estimates are tax-inclusive retail averages. A fleet’s actual fuel mix, discounts, deadhead, fuel economy and invoices can differ. A regional index may be useful, but two weeks cannot establish which index tracks a given lane best.
How we got here
The November 9 national-to-regional benchmark gaps show differences in price level. Comparing each series’ change since October 26 exposes a separate risk: even if the level is reflected in linehaul, future index movements can differ.
Key measures
- U.S. diesel: $6.127/gal · November 9. Down $0.225 since October 26.
- Lower Atlantic: $5.694/gal · November 9. Down $0.196 in the same period.
- California: $7.897/gal · November 9. Down $0.258 in the same period.
- Regional price spread: $2.203/gal · California minus Lower Atlantic on November 9.
Measure price level and rate movement separately
At the November 9 benchmark, the price difference between California and the Lower Atlantic was $7.897 − $5.694 = $2.203 per gallon. At an illustrative 50 gallons per move, that is a $110.15 difference in estimated gross fuel outlay at those retail benchmarks. It is not a recommended surcharge or a carrier invoice.
Using the same illustrative 50 gallons over the two observations, a national benchmark passes through an $11.25 decline. The comparable regional declines are $9.80 in the Lower Atlantic and $12.90 in California. The gaps of $1.45 and $1.65 illustrate the direction of basis risk for one move. Check a longer history and realistic fuel receipts before adopting a benchmark.
Make the surcharge auditable
List fixed linehaul and the surcharge separately. For a gallons-based formula, the indexed price minus the contract’s base price, multiplied by agreed gallons, gives the adjustment before any stated floor, cap or rounding. Keep the base price aligned with the index used to set linehaul. If switching indexes, model the effect of the new base before signing so historical price differences are not charged twice.
For a route that regularly buys fuel in multiple regions, compare a national series and a weighted regional benchmark against the fleet’s documented purchase mix. A uniform corporate index can still be a reasonable choice if the parties quantify and accept the difference.
Checklist for the next bid or renewal
Use the same sample weeks to compare bidder formulas.
- Confirm where fuel is normally purchased and which miles, including eligible empty miles, the quote covers.
- Compare national and regional index changes against representative lane fuel costs.
- Specify the base price and the conversion to dollars per move, including rules for declines and exceptions.
- Run one rising-price and one falling-price invoice example before awarding the lane.
Original sources
- U.S. Energy Information Administration, weekly on-highway diesel prices by region · October 26 and November 9, 2026 observations. November 9 figures released November 10.
Container logistics knowledge center · Dedicated drayage lane sourcing · Submit a private lane